Economic Contribution
|
|
CIBC is a major contributor to the Canadian economy and to the communities in which we work and live. |
We support economic growth and prosperity by creating employment opportunities, purchasing local goods and services, supporting small businesses, helping our clients achieve their financial goals, and by investing in social issues that matter to Canadians.
We also generate strong total returns for our shareholders. CIBC achieved solid results across our business in 2012; our capital position remains among the best of any bank globally and we introduced a broad range of initiatives focused on enhancing the value we provide our clients.
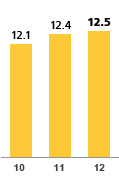
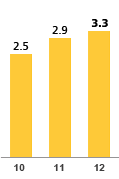
In fiscal 2012, CIBC reported net income of $3.3 billion or $8.07(1) per share on an adjusted basis, compared with $2.9 billion and $7.57(1) a year ago. Revenues rose to $12.5 billion from $12.4 billion and return on equity was once again strong at 22.0%.
CIBC’s earnings strength enabled us to increase our quarterly dividend to 94 cents effective October 2012, while further improving our capital ratios and making broad investments in our network and people.
(1) For additional information, see the "Non-GAAP measures" section of the MD&A
CIBC’s economic contributions (Canadian $, unless noted)
| |
2012 |
2011 |
2010 |
| Revenue |
$ 12.5 billion |
$ 12.4 billion |
$ 12.1 billion |
| Net income |
$ 3.3 billion |
$ 2.9 billion |
$ 2.5 billion |
| Taxes paid in Canada |
$ 1.2 billion |
$ 1.3 billion |
$ 1.4 billion |
| Total shareholder return |
9.8% |
0.4% |
32.4% |
| Debt financing to business |
$ 83.8 billion |
$ 95.8 billion |
$ 84.3 billion |
| Goods and services |
$ 2.5 billion |
$ 2.4 billion |
$ 2.1 billion |
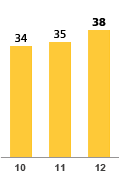
| Community investment |
$ 38 million |
$ 35 million |
$ 34 million |
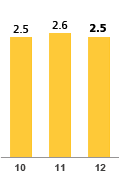
| Employee compensation and benefits |
$ 2.5 billion |
$ 2.6 billion |
$ 2.5 billion |
| |
2011 |
2010 |
2009 |
| Revenue |
$ 12.2 billion |
$ 12.1 billion |
$ 9.9 billion |
| Net income |
$ 3.1 billion |
$ 2.5 billion |
$ 1.2 billion |
| Taxes paid in Canada |
$ 1.3 billion |
$ 1.4 billion |
$ 960 million |
| Total shareholder return |
0.4% |
32.4% |
21.1% |
| Debt financing to business |
$ 95.8 billion |
$ 84.3 billion |
$ 76.8 billion |
| Goods and services |
$ 2.4 billion |
$ 2.1 billion |
$ 1.8 billion |
| Community investment |
$ 35 million |
$ 34 million |
$ 27 million |
| Employee compensation and benefits |
$ 2.6 billion |
$ 2.5 billion |
$ 2.3 billion |
Revenue
($ billion)
|

|
|
Net income
($ billion)
|

|
|
Employee compensation
and benefits
($ billion) |

|
|
Community investment
($ million) |

|
|
| |
|
| |
For what matters |
|
|
Our financial commitment to CIBC employees
Learn more » |
| |
|
| |
|
| |
For what matters |
|
|
Creating value for our shareholders
Learn more » |
| |
|

