Our Initiatives: Environmental Impacts and Performance
Our Environmental Impacts and Performance
Since 2008, our annual revenue has increased by 40%. Through implementing energy efficiency and conservation programs at our corporate offices, manufacturing facilities, and
distribution centres we have been able to reduce our energy intensity back to 2008 levels. We will continue to evaluate opportunities to implement more energy efficiency and
conservation programs across our corporate operations, working towards our goal of a 10% reduction in energy consumption at our corporate offices by the end of 2014. At the Tim
Horton Children’s Foundation we were able to achieve a 10% decrease in direct and indirect energy consumption in 2012 in comparison to 2011 consumption. Furthermore, THCF total
greenhouse gas emissions have decreased by 8% in comparison to 2011 emissions, and 21% in comparison to 2008 emissions. We have been expanding the number of children attending
our camps, and at the same time working towards implementing energy efficiency and conservation programs.
Our Waste Profile
In 2012, we began to measure the waste we create in all aspects of our operations: corporate offices, manufacturing facilities and distribution. This information will act as a baseline as we strive to meet our goal: increasing our diversion rate by 10% across our corporate operations by the end of 2014.
The information provided in the table below is divided into three streams: waste sent to landfill, recycled materials and organics.
1
Waste profile: 2012 is the first year Tim Hortons Inc. landfill waste, recycling, organics and waste diversion rates were calculated. Landfill, recycling, and organics
totals reflect either actual waste amounts or have been estimated to account for volume to weight conversions and/or to account for year-end waste amounts.
The unit of measurement is tonnes.
3
Landfill waste: Where waste amounts to landfill required estimation due to volumes being provided rather than weights, an average volume-to-weight conversion ratio was employed.
The average volume-to-weight conversion ratio was supplied by Spinnaker Recycling Corp.
4
Recycling and organics: Where waste amounts to recycling required estimation due to volumes being provided rather than weights, an average volume-to-weight conversion ratio
was employed. The average volume-to-weight conversion ratio was supplied by Spinnaker Recycling Corp. Additional conversion ratios were sourced from the United States
Environmental Protection Agency’s Standard Volume-to-Weight Conversion Factors, Appendix B.
5
Corporate offices – Tim Hortons University: Tim Hortons University (THU) occupies building space with a corporate restaurant. Both THU and the corporate restaurant share a
waste collection area and one common waste management service. As THU shares a waste management service with the corporate restaurant, waste weight amounts specifically for
THU were not available for the 2012 baseline. Estimates could not be calculated at this time due to the challenge of changing daily programs and activities.
Our Greenhouse Gas Emissions
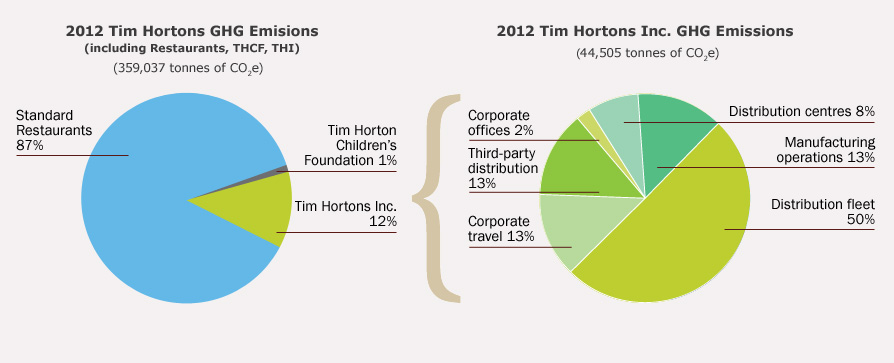
Our total gross greenhouse gas (GHG) emissions for 2012 were 359,037 tonnes of CO
2e. Not surprisingly, the largest portion of our greenhouse gas emissions was generated by our restaurants,
1 which represent approximately 87% of our total emissions. Emissions generated by Tim Hortons Inc. represented only 9% of our total emissions, and approximately 65% of those emissions were generated by our distribution fleet alone. Moving forward, we will continue to focus on reducing the GHG emissions of our restaurants and of our distribution fleet.
Compared to 2011, our total GHG emissions have increased by approximately 43%. The main reason for this increase is an expansion of the scope of our reporting boundary. Specifically, we have now included the emissions from restaurants in the United States to our total restaurant GHG emissions calculations. The addition of our U.S. restaurants represents approximately 24% of all our GHG emissions reported in 2012.
2
We continue to make general energy efficiency improvements to our standard restaurant design, which are incorporated in new restaurant construction and renovation projects. Nevertheless, our business continues to expand. In 2012, we increased the total number of our restaurants (traditional and non-traditional) by 21% and our operations grew to meet this demand.
1
Refers to Canadian and U.S. standard restaurants only.
2
There are 2,454 standard restaurants in Canada and 419 in the U.S.
For a specific breakdown of Tim Hortons GHG emissions, please see the charts below. The first chart represents the Scope 1, 2, and 3 emissions, broken down by category,
for Tim Hortons Inc. (excluding THCF and restaurants).
The second chart represents all the emissions accounted for in our boundary including all THI emissions, Tim Horton Children’s Foundation and emissions for traditional
restaurants in Canada and the U.S.


 Adjust Font Size

 Policies & Archives